
Debt Payoff Spreadsheet vs. Dynamic Planner: Free Template & Why Static Sheets Break
A debt payoff spreadsheet template works well if you only have one or two fixed-rate loans and your extra monthly payment never changes. The moment you juggle four or more credit cards, variable side income, or a 0% promotional balance transfer cliff, static spreadsheet formulas silently break—costing you hundreds in avoidable interest.
If you refuse to hand over your banking passwords to third-party data aggregators, building a debt payoff spreadsheet in Google Sheets or Microsoft Excel is usually your first instinct. A spreadsheet is private, free, and gives you complete control over your numbers. Below, we give you a clean, copy-and-paste multi-card debt payoff spreadsheet template you can use right now—and then show you the exact mathematical breaking points where a static grid fails compared to a dynamic amortization engine like LEVEL.
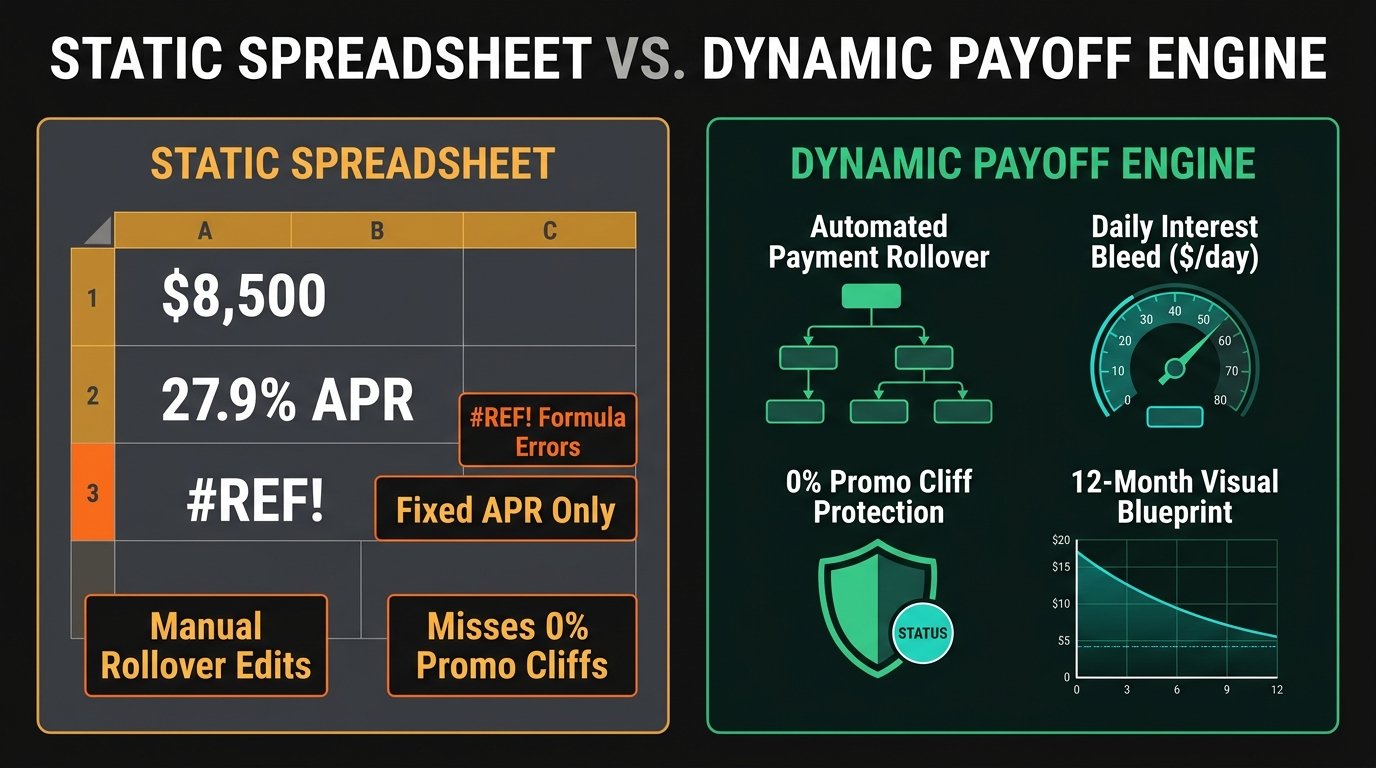
A borrower carrying $24,500 across five credit cards downloaded a popular free Debt Snowball spreadsheet template. Every month, they dutifully typed in their $750 total monthly payment. What the static spreadsheet couldn’t model was a $4,800 balance transfer card sitting at 0% APR whose promotional period expired in Month 7—jumping overnight to 29.99% APR.
Because the spreadsheet sorted accounts only by Day-1 balance and used a single static APR column (`0.00%`), it directed all of their extra cash toward two smaller 19% cards for the first eight months. When Month 7 arrived, the $4,800 balance transfer card began bleeding $3.94 every single day ($120/month) in new compound interest, and when they tried to insert a mid-year rate change row into the spreadsheet, the cascading `NPER` and `PMT` rollover cells threw `#REF!` and `#NUM!` errors across 36 rows.
By moving those exact same five balances into a dynamic multi-loan planner that tracks exact promo expiration dates and Daily Interest Bleed, they pivoted their extra payments 90 days before the promo cliff—saving $1,420 in interest and cutting 5 months off their payoff timeline.
Free Copy-and-Paste Debt Payoff Spreadsheet Template (Google Sheets & Excel)
If you have a straightforward debt portfolio (two or three accounts with fixed interest rates and no promotional cliffs) and want to build your own tracker today, you don’t need to give your email address to download a bloated macro file. Copy the 7-column structure and exact formulas below into Row 1 and Row 2 of any blank Google Sheet or Excel workbook:
| Row | A: Account Name | B: Balance | C: APR (%) | D: Min Pmt | E: Daily Bleed Formula | F: Monthly Interest | G: Standalone Payoff Months |
|---|---|---|---|---|---|---|---|
| 2 | Card A (High APR) | 8500 | 27.99% | 210 | =B2*(C2/365) | =B2*(C2/12) | =IF(D2<=F2, “NEVER”, ROUNDUP(NPER(C2/12, -D2, B2), 0)) |
| 3 | Card B (Retail) | 2400 | 24.99% | 75 | =B3*(C3/365) | =B3*(C3/12) | =IF(D3<=F3, “NEVER”, ROUNDUP(NPER(C3/12, -D3, B3), 0)) |
| 4 | Personal Loan | 5200 | 11.50% | 165 | =B4*(C4/365) | =B4*(C4/12) | =IF(D4<=F4, “NEVER”, ROUNDUP(NPER(C4/12, -D4, B4), 0)) |
What Each Formula in Your Spreadsheet Calculates
- Column E — Daily Interest Bleed (`=B2*(C2/365)`): Multiplies your current balance by your APR divided by 365 days. This exposes the exact dollar amount that account charges you every 24 hours you carry the balance.
- Column F — Monthly Interest Burn (`=B2*(C2/12)`): Shows how much of your monthly payment is immediately swallowed by the lender’s finance charge before a single cent touches your principal.
- Column G — Standalone Payoff Months (`=ROUNDUP(NPER(C2/12, -D2, B2), 0)`): Uses Excel and Google Sheets’ built-in `NPER` time-value-of-money function to calculate how many months that single account will take to reach $0 if you never roll over freed-up minimum payments.
The 4 Reasons Static Debt Payoff Spreadsheets Break in Real Life
Notice what Column G (`NPER`) in a standard spreadsheet cannot do: it evaluates each loan in a vacuum. To model a real Debt Snowball or Debt Avalanche where freed-up minimum payments cascade into the next card the exact month a balance hits $0, a spreadsheet requires a 60-to-120-row month-by-month amortization grid across every single card.
Even if you download a pre-built multi-tab waterfall spreadsheet, four real-world events routinely break static sheets:
1. The Fractional-Month Rollover Problem
When your Target #1 credit card has $190 left on its balance in Month 4, and your combined minimum + extra blitz payment is $450, you don’t pay $450 to that card—you pay $190 to close it, and you immediately have $260 in leftover surplus cash in that exact same month to deploy toward Target #2. Most static spreadsheet templates waste that fractional transition month or require complex nested `MIN()` and `MAX()` array formulas that break the moment you sort a column.
2. Mid-Year APR Changes (0% Promo Cliffs & Hardship Rate Cuts)
Real debt payoff plans aren’t static. You might negotiate a credit card hardship program that drops a 28% APR card down to 6% in Month 3, or you might have a 0% balance transfer whose promotional rate expires in Month 9. In a static spreadsheet with a single “APR” cell per debt, changing the APR in Month 3 overwrites your historical interest calculations for Months 1 and 2.
3. Irregular Windfalls and Cash-Flow Hiccups
What happens when you receive a $2,100 lump sum payout in May, or an unexpected $600 car repair forces you to drop back to minimum payments for one month in August? In a static template, overriding a single cell in Month 5 deletes the underlying formula for that row—often breaking every subsequent row below it.
4. Static Priority Order vs. Dynamic Daily Dollar Bleed
A static spreadsheet sorts your debts once on Day 1. By contrast, a dynamic engine recalculates your priority order every single month. As you pay down a large balance, its actual dollar interest burn drops, and a dynamic planner automatically shows you how your 12-month execution roadmap shifts.
| Capability / Scenario | Static Google Sheets / Excel Template | Bank-Linked Budgeting Apps | LEVEL Dynamic Payoff Architect |
|---|---|---|---|
| 100% Financial Privacy (Zero Bank Sync) | Yes (Manual entry) | No (Requires Plaid bank credentials) | Yes (100% Zero-Bank-Sync privacy) |
| Automated Multi-Card Payment Rollover | Fragile (Breaks if rows are sorted or edited) | Basic (Often single-method only) | Deterministic cent-accurate cascading engine |
| 1-Click Snowball vs. Avalanche vs. Blitz Toggle | Requires duplicating tabs and manually re-sorting rows | Usually locked into Snowball-only or Avalanche-only | Instant side-by-side comparison in 1 click |
| What-If Extra Payment & Windfall Slider | Overwrites baseline cells unless you clone the workbook | Limited or locked behind $109/yr subscriptions | Live What-If Simulator with non-destructive slider |
| 0% Promotional APR Cliff Tracking | No (Single static APR cell per loan) | Rarely supported | Built-in promo expiration & rate-jump modeling |
| Visual 12-Month Execution Checklist & PDF Export | Raw wall of 300+ spreadsheet cells | Backward-looking expense pie charts | Interactive 12-Month Construction Roadmap + PDF |
- Stick with the Free Spreadsheet Template above if: You have only 1 or 2 fixed-rate loans, no 0% promotional balances expiring within the next 18 months, and your monthly payment amount never fluctuates.
- Switch to a Dynamic Planner (LEVEL) if: You are juggling 3 or more accounts, want to toggle between Avalanche, Snowball, and Dynamic Blitz without rebuilding formulas, want to test how extra monthly payments or APR workarounds pull your debt-free date closer, or want a gamified 12-month checklist you can actually stick to on your phone or desktop.
Stop Debugging Broken Formulas—Architect Your Payoff in 4 Minutes
Keep the 100% privacy of a manual spreadsheet while upgrading to a real multi-loan amortization engine. Enter your balances, APRs, and minimum payments into LEVEL to see your Daily Interest Bleed, compare Avalanche vs. Snowball vs. Blitz side by side, and download your 12-Month Construction Roadmap—with zero bank linking required.
Frequently Asked Questions
NPER formula: =NPER(APR/12, -Monthly_Payment, Current_Balance). For example, for an $8,500 balance at 27.99% APR with a $300 monthly payment, enter =ROUNDUP(NPER(0.2799/12, -300, 8500), 0), which returns 47 months.#NUM! error in the NPER function when your monthly payment is smaller than or equal to the monthly interest charge (Balance × APR ÷ 12)—meaning the balance is in negative amortization and will never reach $0 at that payment amount—or when you forget to put a minus sign (-) in front of the monthly payment argument.=Balance * (APR / 365). Tracking this Daily Interest Bleed column is the fastest way to see how much cash each credit card is costing you every 24 hours.